
As a technician, I'm frankly tired of seeing sales quotes that border on misleading advertising. Promises of "50%, 60% or 80% grants", fictitious discounts off the price of an installation and calculations that assume everyone will get a fat cheque from the tax office next year.
Reality is much more interesting: photovoltaic energy remains one of the most profitable investments a homeowner can make, but not because "panels cost 60% less". It's because they combine three completely different sources of return:
- Energy savings over the entire useful life of the installation.
- Tax incentives, when the legal requirements are met.
- Property revaluation.
And here appears the famous "60%". Yes, it exists — but not always. And above all, it doesn't work the way it's usually explained in many ads. To clarify the real figures with numbers, we'll take as an example one of the installations we sell at the company, and we'll see what part corresponds to engineering, what part to taxation and what part is simply marketing.
1. The technology tank: what do you get for €12,000?
Offer for 10 kW solar panel Kit
For very demanding consumption or highly-electrified homes with an EV, the proposed configuration raises the bar with a serious engineering package:
- PV array: 12 kWp total of top-brand solar panels, with excellent performance under local high temperatures and market-leading efficiencies.
- Inverter: Deye Hybrid 10 kW — a beast of power electronics ready to handle significant demand peaks, equipped with full back-up, guaranteeing switching and total energy independence in the face of blackouts or grid faults.
- Storage and back-up: Felicity 16 kWh lithium battery (LiFePO4), enough to bring solid reliability to a grid-backed system.
The technical verdict: for €12,000 (including structure, legalisation, protections, full back-up system, double Energy Performance Certificate, paperwork and fees), the cost per watt and available power are simply spectacular. It's an installation to fully shield yourself from the grid.
For further information, please visit our section on special offers for solar and home automation kits
2. The fiscal fine print: bases, caps and when the 60% STOPS being a myth
Here is where the enthusiast meets bureaucracy, and where fiscal engineering matters as much as electrical engineering. The scope of the works on the property, the results obtained and the property type determine which category you fall into under state and regional rules. However, there's a base incompatibility: you can't count the same euro ppaid when claiming the State income tax deduction (Law 35-2006, DA 50) and the Valencian regional one. The base is consumed. That's why we evaluate the following 3 scenarios:
Scenario A: Without grants or subsidies (any home)
This scenario represents the investment baseline when no direct income-tax deductions apply.
Scenario B: The usual 40% bracket (flats or individual homes)
If you live in a flat inside a block or in a property where the works are justified only for your individual dwelling:
- State deduction (40%): The maximum annual base is €7,500. In our case, \( 7{,}500 \times 40\% = 3{,}000 \text{ €} \). The remaining €4,500 of your €12,000 invoice fall outside the state bracket for exceeding the annual cap that fiscal year.
- Valencian regional deduction (40%): Comes to the rescue on the leftover €4,500 base. \( 4{,}500 \times 40\% = 1{,}800 \text{ €} \), with the advantage that the Valencian Community does allow carrying this balance forward if there isn't enough tax due.
Optimised strategy: The first year you apply the state bracket (€3,000) and defer the €1,800 regional bracket to the second year's return. Total income-tax return: €4,800 (you recover an effective cumulative 40%).
Scenario C: The "Holy Grail" of 60% (villa or single-family in a complete building)
Why do many companies sell the 60% carelessly? Because to apply it legally in a villa, the tax office requires the property to be a complete building.
If your Cadastre record explicitly states "Parcel built without horizontal division" (i.e. a single reference where the villa, roof and plot are an indivisible whole belonging to you), the law allows the technician to issue the Energy Performance Certificate (CEE) ticking the "Complete Building" box. Entering the Energy Refurbishment of Buildings modality (60%), we activate maximum fiscal optimisation by splitting the base across 4 years:
- Base split: We divide the €12,000 invoice across the 4 years allowed by the rule.
- Annual deduction: \( 3{,}000 \times 60\% = 1{,}800 \text{ €/year} \) collected in each return over 4 years.
Total income-tax return: €7,200 (a real 60% back on your €12,000 invoice!). Since the base is fully consumed by the state bracket, no leftover remains for the regional one, but you take home the biggest fiscal slice possible.
Does meeting these conditions mean I can apply the deduction? Well, we don't know. If the Spanish tax office is known for anything, it's for being — to put it mildly — a "headache" for taxpayers. There are binding rulings on this topic such as V1368-22 or V1559-24, which specify that a single-family home can access Scenario C (60%). But there are hundreds of testimonies of people who received a parallel assessment asking them to correct the deduction — which is why it will always be a personal decision at tax-return time.
3. Who can make the most of these deductions? (The importance of the tax due)
There's a detail that's rarely explained in sales ads and that can make a big difference to the final result: income-tax deductions don't work as a guaranteed cheque — they can only be applied up to the limit allowed by the tax due in each fiscal year.
In other words, it's not enough to make the investment. You also need to generate enough tax due to absorb the yearly deduction. The lower the taxpayer's income, the lower the available tax due, and therefore the higher the probability of not fully using the deduction that year.
To make this easier to understand, we've built an example using a specific and homogeneous taxpayer profile.
Example assumptions
The figures below correspond to a taxpayer with the following characteristics:
- Spanish tax resident.
- Individual filing.
- Single.
- No children.
- No disability.
- No other relevant income or deductions.
- For self-employed, only the net activity yield is considered.
* These assumptions allow comparing scenarios under the same criterion, though the real result may vary depending on each taxpayer's personal and family circumstances.
Scenario B: 40% state deduction + 40% Valencian regional deduction
Here the deductions aren't concentrated in a single fiscal year, but spread according to the applicable rule:
- Year 1: state deduction of €3,000.
- Year 2: regional deduction of €1,800, corresponding to the base leftover after the state deduction.
By spreading deductions across years, the tax due needed to absorb them is also spread over time, lowering the income level required compared to applying the whole deduction in one go.
Scenario C: 60% deduction for complete-building energy refurbishment
Here the fiscal strategy is even more favourable from the annual tax-due standpoint. The investment base is spread across the four years allowed, producing a deduction of about €1,800/year for the following 4 fiscal years (€7,200). Because it's a smaller annual deduction spread over time, it's easier to have enough tax due to absorb it in full.
Indicative economic profile in the example
Under the assumptions above, the income levels that allow fully using the example's deductions are approximately:
| Taxpayer profile | Scenario B | Scenario C |
|---|---|---|
| Employee (gross annual salary) | 33.800 € – 35.000 € | 25.250 € – 27.000 € |
| Self-employed (annual net yield) | 37.400 € – 39.000 € | 28.600 € – 29.500 € |
Important note: These figures correspond exclusively to the example developed in this article and should not be interpreted as a legal requirement nor as a threshold applicable to every taxpayer. The real ability to apply the deductions will depend on the gross tax due available each year, as well as on personal and family circumstances, other income, reductions, deductions and every other element of income-tax settlement.
In short, the important message isn't that a "minimum salary" exists to install solar panels — it's that tax planning is also part of a good investment. Just as an installation is properly sized to optimise output, it's wise to first analyse the taxpayer's fiscal situation to make the most of the available deductions and avoid losing part of the fiscal benefit because of insufficient tax due.
4. The real balance: three scenarios side by side
With 12.2 kWp on the roof and 16 kWh of batteries, the estimated energy saving with Virtual Battery and EV charging comes to around €2,300/year (~€191.67/month net).
In all three scenarios the initial outlay on Day 0 is exactly the same (€12,000). The difference isn't in buying a cheaper installation, but in the liquidity recovered via annual cash flows from tax refunds and municipal reductions:
| Item | Scenario A (no income-tax) | Scenario B (income-tax 40% state + 40% CV) | Scenario C (income-tax 60% complete building) |
|---|---|---|---|
| Initial outlay (Day 0) | €12,000 | €12,000 | €12,000 |
| Income-tax flow Year 1 | €0 | +€3,000 | +€1,800 |
| Income-tax flow Year 2 | €0 | +€1,800 | +€1,800 |
| Income-tax flow Year 3 | €0 | €0 | +€1,800 |
| Income-tax flow Year 4 | €0 | €0 | +€1,800 |
| Property-tax (IBI) reduction (3-year total) | +€1,050 | +€1,050 | +€1,050 |
| Total return from aid / tax | €1,050 | €5,850 | €8,250 |
| Annual energy saving (with Virtual Battery) | ~€2,300/year | ~€2,300/year | ~€2,300/year |
| Time to pay back €12,000 (Payback) | 4 years 8 months | 2 years 9 months | 2 years 8 months |
5. How does a PV installation compare against a financial product?
One of the most interesting comparisons is asking what would have happened if, instead of investing €12,000 in a PV installation, the same amount had been placed in a low-risk financial product such as a bank deposit. The answer can't be obtained by comparing annual yield or payback period alone. For the comparison to be rigorous, both alternatives need to be analysed through cumulative cash flows, considering both when each income occurs and how the investment evolves over time.
Assumptions used
To compare both alternatives under the same financial criterion, the analysis uses the following assumptions:
| Item | Value |
|---|---|
| Initial investment | €12,000 |
| Energy saving first year | €2,300 |
| Annual growth of energy saving | 1% |
| Property-tax reduction | €350/year during first three years |
| Financial product | 3% APR |
| Taxation of the financial product | 19% on interest earned |
*The 1% annual growth of the energy saving doesn't try to predict the future evolution of the power market. It's just a conservative working assumption reflecting moderate electricity-cost growth. If energy prices rose above that, the installation's profitability would be higher; if below, lower For greater accuracy, please refer to the historical data from EUROSTAT.
Criterion used in the comparison
Before interpreting results, it's important to understand what each of the chart's curves represents.
Financial product
In a bank deposit, the initial capital remains available at all times. Even while invested, the wealth still exists and keeps generating interest.
Because of that, the financial-product curve starts at €12,000, representing the capital available from day one plus the yield accumulated over the years.
PV installation
In the PV investment something different happens: the €12,000 stop being available as of the day of installation and turn into a physical asset.
Because of that, the model represents the net cash position of the investment, starting at −€12,000. From there, the financial position progressively recovers thanks to:
- Annual savings on the electricity bill.
- Income-tax deductions when applicable.
- Municipal property-tax reductions.
This approach reproduces the real economic behaviour of the investment much more faithfully than treating fiscal deductions as a discount on the initial price.
Financial evolution
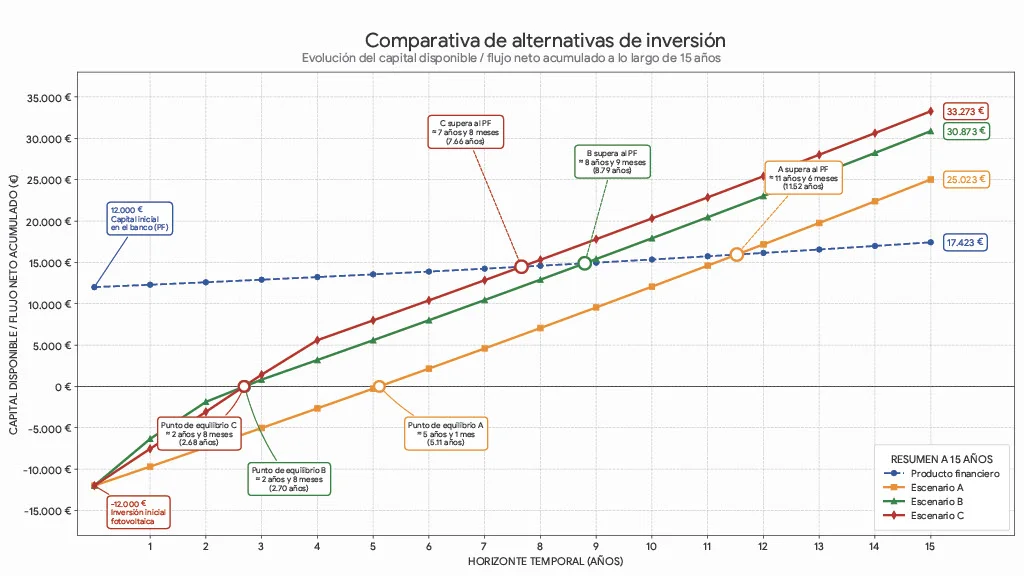
Interpretation of results
The differences between the four scenarios are evident. The bank deposit always preserves the initial capital and generates a stable return through compound interest. It's a liquid, low-risk investment, though with relatively moderate growth.
The PV installation, by contrast, behaves completely differently. In the first years the financial position is negative because of the initial outlay. However, as energy savings accumulate and fiscal deductions and municipal reductions arrive, the investment progressively recovers the capital spent, reaches break-even and starts generating net profit. Two milestones matter:
1. Investment break-even (crossing €0)
- Scenario A: 5 years 1 month
- Scenario B: 2 years 8 months
- Scenario C: 2 years 8 months
2. Moment when PV beats the bank deposit
- Scenario A ≈ 11 years 6 months
- Scenario B ≈ 8 years 9 months
- Scenario C ≈ 7 years 8 months
As the years pass, the growth of the energy saving — even though we've conservatively estimated it at 1% per year — widens the gap against the financial product.
A comparison based on real cash flows
It's important to stress that this study does NOT claim that a PV installation is always better than any financial product.
Each alternative has different characteristics in terms of liquidity, risk, time horizon and capital availability.
What this analysis does show is that, under the assumptions used in this article, a properly sized PV installation can generate a very competitive cumulative cash flow, especially when fiscal incentives and municipal reductions apply.
The fundamental difference is that the bank deposit earns its yield exclusively through interest, while the PV installation combines two independent value-creation sources:
- Permanent savings on the electricity bill.
- Fiscal incentives foreseen by law.
It's precisely the combination of these two factors that explains the high yield observed in the analysed scenarios, without resorting to simplistic messages like "the installation costs 60% less".
Conclusion
The yield of a PV installation should not be evaluated solely by its payback period or the size of the fiscal deductions — positive aspects such as property revaluation in the real-estate market also matter.
The most appropriate criterion is to analyse cash-flow evolution over time and compare it against other investment alternatives under the same economic assumptions.
When the analysis is done this way, results show that photovoltaic energy can become a highly competitive investment — not because it artificially cuts the purchase price, but because it turns a recurring expense (the electricity bill) into a permanent saving, complemented by the fiscal incentives foreseen by law and the municipal reductions available.