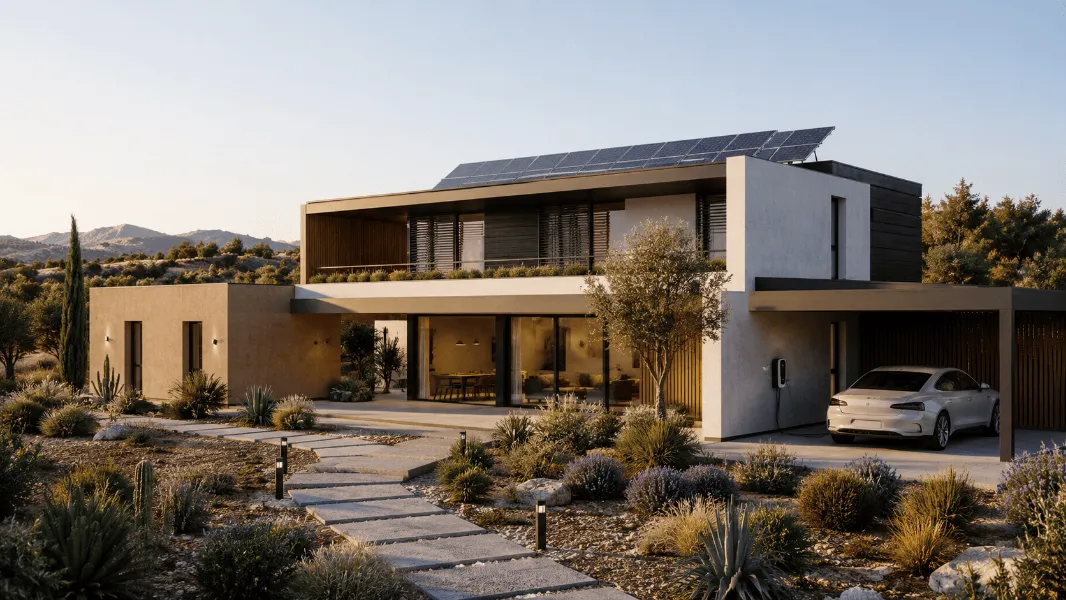
In this article, we will compare 10 energy efficiency and saving strategies that we previously analysed on the blog, taking into account the very specific climatic conditions of the eastern part of the Iberian Peninsula and the composition of Spain’s housing stock
1. Climate context and thermal zoning
To carry out a rigorous analysis in the Levante region, it is essential to differentiate two opposing climate realities under the Spanish Building Technical Code (CTE):
- Coastal zone (A4 / B3 — Alicante, Torrevieja, Cartagena, Benidorm):
- Summers: long, hot and with very high relative humidity (high latent load).
- Winters: clear skies and mild temperatures (rarely < 7 °C).
- Climate control split: 75% cooling / 25% heating.
- Inland zone (C3 / D3 — Villena, Alcoy, Yecla, Lorca, Requena):
- Summers: very hot and dry, with a wide day/night temperature swing.
- Winters: cold and harsh, with frequent frost and sub-zero temperatures.
- Climate control split: 45% cooling / 55% heating.
2. The problem of "trap metrics" in energy savings
In our industry it's common to hear claims like: "With this window you'll save 30% on climate control" or "This air conditioner consumes 40% less". Although technically true in their own domain, they create false expectations for the customer, who tends to assume the total bill will drop by that same percentage.
To avoid that distortion, we take a typical all-electric home as a baseline (~7,000 kWh/year / €1,400/year of spend) and translate the sectoral saving (what the equipment improves in its own area) into savings on the total annual bill. Based on the data published by IDAE (Spain's national energy-efficiency agency):
- Base consumption split (coast): climate control 50% | DHW 20% | appliances and lighting 30%.
- Base consumption split (inland): climate control 55% | DHW 20% | appliances and lighting 25%.
3. General matrix of efficiency strategies (coast vs. inland)
Below we compare 10 of the most common industry strategies for improving a home's energy efficiency, looking at their thermal behaviour by geographical zone, investment ranges and real direct impact on the annual bill.
| Strategy | Behaviour and context by zone | Approx. cost | Sectoral saving (specific) | % saving on total annual bill |
|---|---|---|---|---|
| PV + Virtual Battery | Coast / Inland: high-performance, optimised system that virtually zeroes out the electricity bill all year round. | €7,000 – €15,000 | 95% – 100% (global) | 95% – 100% |
| Inverter climate control / heat pump | Coast: high SEER overcomes summer humidity. Inland: high SCOP delivers 400% performance (SCOP > 4.0) in heating. |
€1,000 – €3,500 | 30% – 50% (climate control) | Coast: 12% – 20% Inland: 14% – 24% |
| Heat pump water heater for DHW | Coast: constant maximum performance (COP ≥ 3.8). Inland: slight dips during night frost (COP ~ 2.8 – 3.2). |
€850 – €2,500 | 60% – 75% (DHW) | Coast: 13% – 17% Inland: 12% – 16% |
| Façade insulation (SATE — external thermal insulation / insufflated cavity fill) | Coast: stops summer radiation from entering. Inland: absolute priority to prevent heating losses in winter. |
€1,500 – €18,000 | 25% – 40% (climate control) | Coast: 10% – 16% Inland: 12% – 19% |
| Roof insulation | Coast: halts overheating from zenith radiation. Inland: retains the upper heat pocket in winter and shields against the summer sun. |
€1,500 – €5,000 | 20% – 35% (climate control) | Coast: 8% – 14% Inland: 10% – 17% |
| Windows (solar control + low-emissivity) | Coast: the g-factor (solar control) blocks radiation. Inland: the U-value insulation retains heat in winter. |
€3,000 – €8,000 | 15% – 30% (climate control) | Coast: 6% – 12% Inland: 7% – 14% |
| Technical home automation | Coast: switches on A/C during peak solar production hours. Inland: manages thermal inertia and solar pre-heating. |
€1,500 – €3,500 | 10% – 30% (management) | Coast: 4% – 12% Inland: 5% – 14% |
| Thermostatic mixing valve (DHW) | Coast/Inland: keeps the tank at 65 °C (anti-legionella) and delivers water at 40 °C. Avoids pointless dissipation. | €40 – €80 | 8% – 12% (DHW) | 1.5% – 3% (+ water savings) |
| Bioclimatic / evaporative sources | Coast: little effective because of coastal humidity. Inland: very effective thanks to dry summer air. |
€600 – €4,500 | 3% – 8% (cooling) | Coast: 1% – 2% Inland: 2% – 4% |
| Green façades / shading | Coast: living shade over south/west walls. Inland: shade in summer; if deciduous, lets sunlight through in winter. |
€500 – €15,000 | 5% – 25% (cooling) | Coast: 1.5% – 6% Inland: 2% – 7.5% |
4. Practical case studies: typical villa
- Home parameters: single-family villa with 100 m² of usable floor area, south-facing (azimuth = 0), 110.7 m² vertical envelope, 100 m² roof, 10 m² of windows and 4 regular residents.
- Real consumption: 7,000 kWh/year, equivalent to €1,400/year (€0.20/kWh).
Unified comparison: modern home (Scenario A) vs. traditional home (Scenario B)
In the following table we assess each energy-efficiency and self-consumption strategy for both climate zones, coast and inland:
-
5% of homes fall into SCENARIO A (CTE 2007–2013): walls with basic insulation (3–5 cm), windows with standard double glazing (4/8/4) without a low-emissivity coating, and equipment around 15 years old.
- 38% of homes fall into SCENARIO B (NBE-CT-79 / Pre-CTE 2007): completely empty air cavities, untreated thermal bridges, single-aluminium windows or basic glass without thermal break, and heavy reliance on stoves or old water heaters.
- 54% of homes belong to NEITHER SCENARIO: built before 1980, they therefore predate any energy-efficiency regulation.
| Strategy | Approx. investment | Saving Coast (€/year) (Sc. A / Sc. B) |
Payback Coast (Sc. A / Sc. B) |
Saving Inland (€/year) (Sc. A / Sc. B) |
Payback Inland (Sc. A / Sc. B) |
|---|---|---|---|---|---|
| PV + Virtual Battery | €7,800 | €1,330 / €1,400 (95%-100%) | 5.6 / 5.8 years | €1,330 / €1,400 (95%-100%) | 5.6 / 5.8 years |
| Inverter climate control | €2,500 | €315 / €346 | 7.9 / 7.2 years | €346 / €390 | 7.2 / 6.4 years |
| DHW efficiency pack (heat pump water heater + valve) | €1,060 | €240 (17.1%) | 4.4 years | €225 (16.1%) | 4.7 years |
| Insufflated cavity-fill façade insulation | €2,500 | €230 / €270 | 10.9 / 9.2 years | €280 / €347 | 8.9 / 7.2 years |
| Roof insulation | €2,000 | €195 / €230 | 10.3 / 8.7 years | €240 / €260 | 8.3 / 7.7 years |
| Window replacement (10 m²) | €3,500 | €160 / €210 | 21.9 / 16.7 years | €200 / €275 | 17.5 / 12.7 years |
| Home automation control | €1,200 | €110 / €120 | 10.9 / 10.0 years | €130 / €145 | 9.2 / 8.3 years |
| Thermostatic mixing valve | €60 | €30 (2.1%) | 2.0 years (0.9 with water saving) | €30 (2.1%) | 2.0 years (0.9 with water saving) |
| Bioclimatic sources | €800 | €20 / €22 | 40.0 / 36.3 years | €45 / €50 | 17.8 / 16.0 years |
| Green façades / shading | €500 | €50 / €58 | 10.0 / 8.6 years | €70 / €75 | 7.1 / 6.7 years |
5. Prioritisation rankings (closing summary)
To help with strategic and budgetary decisions, we summarise the assessed solutions ordered under two key criteria: the total impact on cutting the annual bill and the speed of financial payback of the initial investment.
Top 5: Biggest absolute saving on the bill (maximum impact)
| Ranking | Strategy | Approx. investment | Annual saving (€/year) | % saving on total bill |
|---|---|---|---|---|
| 1 | PV + Virtual Battery | €7,800 | €1,330 – €1,400 | 95% – 100% |
| 2 | Inverter climate control (heat pump) | €2,500 | €315 – €390 | 22% – 28% |
| 3 | Insufflated cavity-fill façade insulation | €2,500 | €230 – €347 | 16% – 25% |
| 4 | DHW efficiency pack (heat pump water heater + thermostatic valve) | €1,060 | €225 – €240 | 16% – 17% |
| 5 | Roof insulation | €2,000 | €195 – €260 | 14% – 19% |
Top 5: Biggest return per euro invested (minimum payback)
| Ranking | Strategy | Approx. investment | Estimated payback | Key to financial performance |
|---|---|---|---|---|
| 1 | Thermostatic mixing valve | €60 | 0.9 – 2.0 years | Micro-investment with almost immediate return (+€30/year of direct saving on water). |
| 2 | DHW efficiency pack (heat pump water heater + thermostatic valve) | €1,060 | 3.9 – 4.7 years | Integrated DHW solution that pays back in less than 5 years. |
| 3 | PV + Virtual Battery | €7,800 | 5.6 – 5.8 years | Guarantees 95%-100% real self-consumption, delivering the fastest return for full-scope installations. |
| 4 | Inverter climate control | €2,500 | 6.4 – 7.9 years | Replaces obsolete technology, drastically cutting consumption in both cooling and heating. |
| 5 | Green façades / shading | €500* | 6.7 – 10.0 years | High passive efficiency when deployed as a lightweight installation on critical orientations. |
*Note: estimated cost for a simple shading or vegetation system on south/west façades.
6. Technical recommendations
- Leadership of the PV system: guaranteeing 95% to 100% real self-consumption on the total bill (up to €1,400/year of savings on the base), the PV + Virtual Battery solution at €7,800 pays back in only 5.6 to 5.8 years, standing out as the cornerstone of the efficiency plan.
- Effect of building age on the passive envelope: in homes built before 2007, passive solutions (insufflated cavity-fill façade insulation and roof insulation) cut their payback periods to 7.2 – 7.7 years in the inland zone by stopping massive winter heating losses and the summer thermal overload.
- Comprehensive DHW optimisation: integrating the DHW Efficiency Pack is the measure with the best cost-benefit ratio in the home's thermal equipment, allowing the hot-water line item to be paid back in just over 4 years by combining electricity and water savings.
7. Grants and subsidies: an opportunity to shorten the payback period
Initial cost is one of the main factors determining the profitability of an energy-efficiency measure. However, not all investments are treated the same when it comes to accessing public grants, tax deductions or compensation mechanisms.
Of the strategies analysed, we can draw an initial division between those that may fit within energy-efficiency support programmes and those whose return depends mainly on the savings the installation itself generates.
Strategies that may benefit from grants or incentives
This group mainly contains measures directly linked to reducing energy demand, refurbishing the envelope and efficiently electrifying the home:
- Photovoltaics and self-consumption.
- Heat pump climate control.
- Heat pump water heater for DHW.
- Façade insulation.
- Roof insulation.
- Window replacement or renovation.
- Home automation and energy control systems.
Depending on their characteristics, the type of home and the specific call for grants, these measures may fit within different aid programmes, tax deductions or energy-saving mechanisms. The Energy Savings Certificates (CAE) scheme, for example, currently covers residential measures related to the thermal envelope, heat pumps, windows and automation and control systems.
In addition, certain energy-efficiency improvement works may open the door to deductions on personal income tax (IRPF, Spain's income tax) when the requirements are met and the required improvement is evidenced by an Energy Performance Certificate (CEE). In 2026 there is also a specific deduction for certain renewable self-consumption installations.
Strategies whose return depends mainly on the investment itself
There are other solutions for which it is harder to point to a specific energy grant, and whose economic appeal comes mainly from the savings they generate:
- Thermostatic mixing valve.
- DHW pipe insulation.
- Bioclimatic or evaporative sources.
- Green façades and shading solutions.
This doesn't mean it's impossible to find a local programme or specific call that might affect any of them. It simply means we shouldn't factor in public aid as part of the initial economic case unless a concrete, applicable call is in place.
By how much can the payback period change?
The effect can be considerable. If a measure costs €2,000 and generates a saving of €250/year, its theoretical payback would be:
But if a grant were to cut the effective cost of the measure by 30%, the investment would fall to €1,400 and the payback period would drop to approximately:
In other words, a 30% grant can shorten the payback period by roughly 30%, provided it's a grant that truly reduces the cost borne by the owner.
In practice, the calculation can be more complex when we're dealing with tax deductions, CAE or other incentive mechanisms, so a grant percentage shouldn't be applied automatically to any project.
The key is to study the measure before executing it. The same solution can have a very different payback depending on the home, its location, its current energy state, the investment required and the incentives available at the time.
That is why, before choosing between insulation, climate control, self-consumption, DHW, windows or any of the other strategies analysed, the advisable approach is to sit down with a professional and jointly study current consumption, the characteristics of the home, the investment needed, expected savings and the grants or deductions on offer.
A good decision isn't simply about picking the technology that saves the most, but about finding the combination of measures that offers the best balance between investment, savings, comfort and payback period for each home.